![]() January 1997
January 1997
A general opinion (as voiced in the Six and Ten Report ) was that 1996 Sporadic E (Es) was poor at high frequencies and for short skip but reasonably good at lower frequencies and for long haul (multi-hop) propagation. Conditions were relatively very poor in June and December, somewhat better than 'normal' at other times. How people rated the year overall varied considerably. 2m operators and those who relied on June propagation for dx contacts were disappointed, others were pleasantly surprised to find 50 MHz openings (including trans-Atlantic) outside of the expected norms. Whatever your opinion, the distribution of Es in 1996 was clearly unusual. The purpose here is to quantify the distribution and see if the season's unusual features help identify relationships with, and causes of, Es.
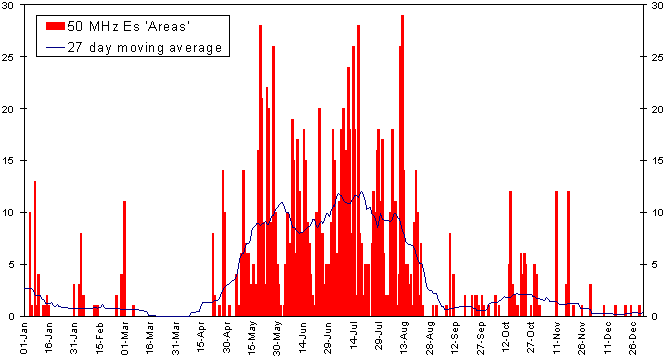
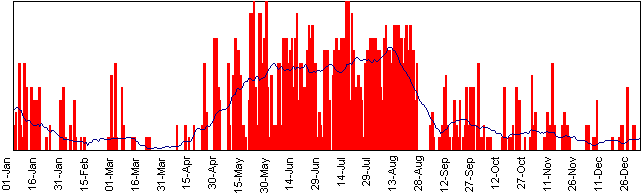
Es activity at 50 MHz is measured in these Reports by an 'areas' measure based on countries heard/worked from the UK. The daily areas count provides the raw data for the work presented here. Note that high values of the 'areas' variable mean geographically widespread events, but not necessarily short skip or high MUF events. Graph 1 shows the daily 50 MHz areas numbers for the year, plus a 27 day moving average of the same data (this used to smooth short term variance and remove any effects related to solar rotation). The graph shows features common to any year - a major Es season in the summer, and a minor season in mid-winter (good in January, poorly defined in December). There is also an autumnal event (a common feature, but not often recognised) that has no counterpart in the spring. Note the several isolated (and unusually strong) Es events in February and November. May and August had some of the best days for Es of the year. For comparison, graph 2 shows equivalent data for 1996 28 MHz areas.
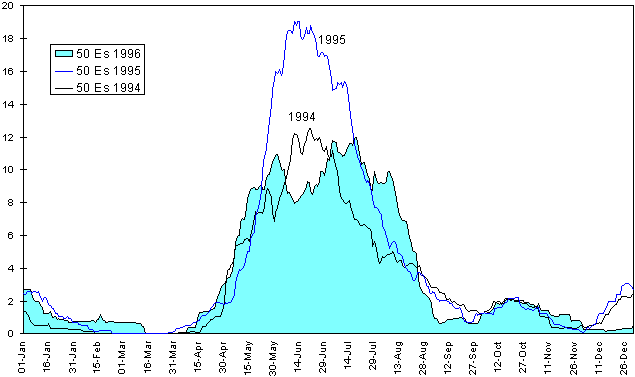
Graph 3 shows the 1996 season (as represented by areas 27 day averages) compared with equivalent data from 1995 and 1994. The gross distributions are similar, but while 1994 and 1995 both had "classic" bell-shaped summer Es distributions, 1996 has a "decapitated" summer distribution. Note the broader flanks to the summer 1996 distribution (indicating better April and August Es than in the previous 2 years), the notable dip in June corresponding to the poor mid-summer conditions, and the almost complete absence of winter Es in December. 1995 was clearly much the best of the last 3 years, though one should be careful of interpreting absolute values because of the way the data is calculated from an imprecise countries score. Although the 1996 distribution is strange, the amount of Es present at 50 MHz over the year was very similar to that in 1994.
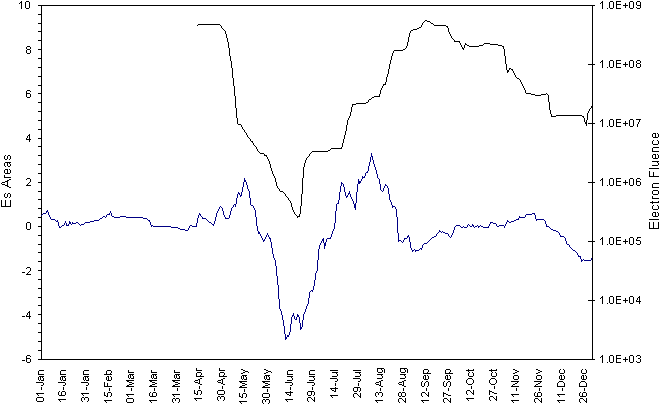
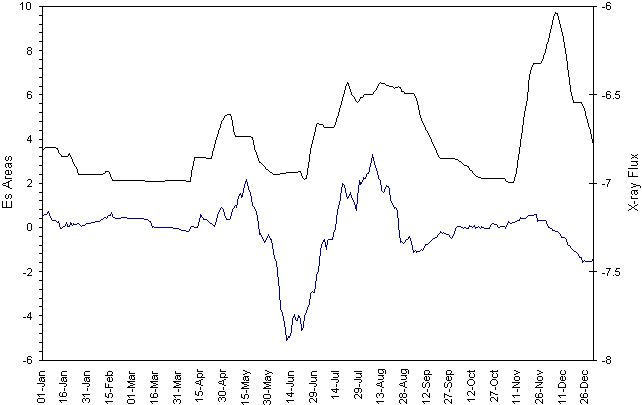
Can we explain the unusual distribution of Es in 1996? The presentation in graph 3 is not very helpful because the overall distributions are dominated by seasonal trends. To identify the true relative differences between the 1996 distribution and those of previous years residual values have been calculated - these are the simple difference between the 1996 Es areas 27 day moving average and a 3 year mean (moving average) value. Residual values are shown plotted on the two graphs opposite. Negative values indicate conditions poorer than average, positive better than average. The data are most reliable for the summer months. The 1996 residual line seen in graphs 3 and 4 show clear negatives in June and December (indicating much poorer than average) but positives for April-May and July-August (better than average). This broadly agrees with the opinions of 50 MHz operators.
Why were June and December so poor (and the other months relatively good?). Graphs 3 and 4 show greater than 2 MEV electron fluence data and background x-ray flux (both also as 27 day moving averages) plotted with the 1996 Es residual data. The visual correlation of these particular data speak for themselves. How significant or otherwise these data may be is open for discussion, but variance in both x-ray flux and electron fluence have been used in previous studies to explain Es distributions. For example Ray G2AHU (in October 1994 6 & 10 Report) discussed the anti-correlation of electron fluences with solar activity over a solar cycle, and the potential positive correlation with Es. Recently GJ4ICD has pointed out apparent correlations of x-ray flux with Es events - see later in this report, for example. Factors such as 2800 MHz solar flux, Ap indices and proton fluence data show no obvious correlations with the 1996 residuals data. Of course more work is needed to pin down the relationships that appear to exist, but at the very least the data presented here indicate new avenues for research into the causes of Sporadic E.